Viewing entries tagged
Forbes

America's Most Overpriced Cities 2014

Comment

America's Most Overpriced Cities 2014

Forbes' Erin Carlyle recently chronicled the countries most expensive cities and many  California cities found themselves labeled "overpriced." In fact, California cities showed up most often on the list taking a whopping 9 spots. Covering the entire state, San Francisco, Fresno, L.A., Riverside and San Deigo all made the list, with L.A. snatching up the #20 position. Of relatively little surprise, Honolulu, Hawaii and New York City tied for first followed by South Connecticut and Boston. Philidelphia, Miami, Portland, North New Jersey and Long Island, N.Y. all made the list as well.

Aloha - Honolulu made a great case for being the most overpriced city with a median housing price of $430,000 and an exorbitantly high cost of living. While the median home price does not reflect the highest in the counrty for a Metropolian area, it is financially out of reach for most of the city's resident families earning the median income of $86,300 per year. Cost of living plays a major role as well, with groceries costing an astounding 55% more than in the rest of the country and utilities costing - wait for it - 67% more.

Forbes compiled this data by looking at Metropolian Statistical Areas (areas with populations of 600k or more), and housing affordability and cost of living index in these areas.

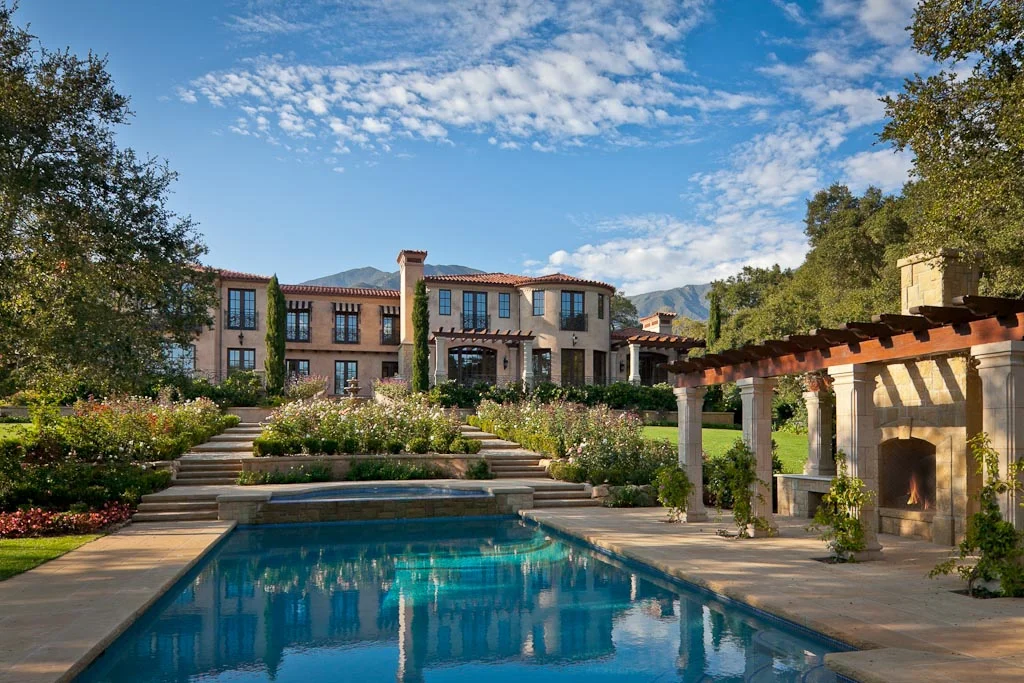
Santa Barbara's humble approx. 89,000 population disqualified the city as a Metropolitan Statistical Area. With is no shortage of adventure, culture and cuisine in the area, and a airport an airport for quick jaunts to L.A., the Bay Area and beyond, Santa Barbara is an ideal town.

Comment

Comment

Housing Market's Recovery Barometers reads: 61%

Trulia reports the housing market is 61% back to normal.

Online real estate giant Trulia's Housing Barometer charts the market improvement each month, tracking how quickly the housing market is moving "back to normal." An article posted on Forbes.com's real estate section discusses the three key pieces that paint this market picture for us:

  • Construction starts: this represents the number of new homes being built throughout the country. Increased number of construction starts equates to housing availability and inventory for homebuyers. In May, starts were over 900,000, a healthy boost from April up 7%.
  • Existing home sales: As inventory begins to expand, we begin to see a rise in sale of existing homes. Just over 5 million homes sold in May 2013, up 4% from April and a whopping 23% increase year over year. May was also the 4th straight month of inventory expansion.
  • Delinquency + foreclosure rate: As we see the market begin to regain a sense of normalcy, we want to see this number drop. And in May, thats exactly what it did, to 9.13% from last years 11.08%. Fewer people are falling behind on their mortgages gently pushing the delinquency + foreclosure rate down. It is currently 57% back to normal.

By comparing these numbers to (1) their pre-recession "normal" numbers and (2) the numbers at their worst, we are able to see the market's recovery rate, exactly how close we are to a full recovery, and when we can expect that 100% recovery we are all anxiously awaiting. One year ago, the market was just 35% "back to normal" and this is the first time the barometer has crossed over into the 60th percentile.

Comment